
Forecasting for an Uncertain Fiscal Future
Robert Leland has 40 years’ experience in state and local government and is a senior advisor for Management Partners. He can be reached at rleland@managementpartners.com.
Like many cities, Stockton used to budget a year at a time and assume that the following year would look a lot like the previous ones, which through fiscal year 2007–08 had been very good indeed. Then the Great Recession hit, and high-cost decisions made when times were good led to bankruptcy for Stockton, as well as serious cutbacks for other cities throughout California and the nation. As part of its plan of adjustment, Stockton prepared a 30-year budget forecast to demonstrate financial solvency to the bankruptcy court, and in its recovery the city continues to use a long-term financial plan. Now officials and residents can understand how pay increases, new debt, rising near-term pension costs, revenue changes and inflation will affect the city’s finances — not just next year, but far into the future.
“It changes the knowledge base of both the decision-makers and those affected by the decisions,” says Claire Tyson, Stockton’s budget director. “Realizing the effects of something like a 30-year loan going forward has been helpful in getting everyone on the same page. Our forecast is a living document, and every time we make changes to the budget we see what the impacts are.”
The lingering revenue effects from the Great Recession, changes to pension contributions, rising retiree medical costs and other factors almost guarantee that the financial future for California cities will bear little resemblance to the past. Though long-term fiscal forecasting remains the exception among California cities, a growing number are using the practice to understand the true costs of their obligations and prepare for the inevitable future economic downturns. These budget models can provide cities an honest look at where they are headed financially and what they must do to:
- Rebuild their financial reserves;
- Pay for needed upgrades to facilities, technology and equipment; and
- Maintain or improve levels of service to residents.
All cities should have this information but too few do, even where good management and substantial reserves exist.
How We Got Here
Understanding how we arrived at the current challenges faced by most California cities helps illustrate why better forecasting is essential to their future fiscal health. Even as we move away from the Great Recession, it’s clear that few cities will “recover” from its effects, if recovery is defined as returning to pre-recession revenue trends. Even where the impact of the recession was less pronounced, a gap of 30 to 50 percent persists between the direction of recurring revenue based on pre-recession trends and actual revenue since that time. This seems to be true of cities large or small, wealthy or poor, urban, suburban or rural.
In some cities, strong pre-recession finances led to a series of bad policy decisions and fiscal mismanagement that contributed to today’s problems. These policy decisions include:
- Labor agreements that automatically link compensation to pay in other cities;
- Excessive promises of retiree health care, including unlimited benefits and limited or no vesting periods;
- Debt undertaken on high-end amenities (which counted on revenues that didn’t materialize, such as from new development); and
- Subsidies to enterprise activities that can’t pay for themselves.
Examples of fiscal mismanagement include inadequate reserves, booking uncollectible receivables, inadequate cost recovery, relying on pooled cash to pay the obligations of funds running ongoing deficits, and omitting negative fund balances from budget documents. In addition, factors like changing pension rates will disrupt the fiscal outlook of most cities during the next few years.

Modeling for the Future
The most useful models for local governments to use in long-term forecasts rely on a variety of data to examine different scenarios of what the future might hold. By looking at key variables such as payroll growth, pension rates, property taxes and sales taxes, cities can create a forecasting model specific to their community. The model reveals the long-term consequences of absorbing pension and health costs, the impact of boosting service levels or adopting labor proposals, restoring deferred infrastructure spending and internal service contributions for long-term sustainability, and other factors unique to a city.
The computer models now used by cities like Stockton, Morro Bay and Oxnard begin with a baseline forecast, which reflects a continuation of current revenues and service levels. This forecast allows the selection of three revenue scenarios — the most likely growth rate, an optimistic higher-growth rate and a pessimistic lower growth rate — and shows the impact of a hypothetical recession in the near future. By examining different scenarios, the forecasts can help cities to build up reserves in good times and prepare for the recessions that occur on average every six to eight years.
Typically this process involves creating a computer model that projects revenues and expenditures over 10 years, with a special focus on the top three revenue sources (usually 60 to 70 percent of total General Fund revenues) and the primary source of expenses, personnel (also in the 60 to 70 percent range of total General Fund expenditures). Estimates from the city’s revenue consultants, a long-term forecast created for property taxes and a long-term forecast for California Public Employees’ Retirement System (CalPERS) costs are used. Building the model on spreadsheets previously prepared by the city makes it familiar to staff and helps ensure it will be used and updated in coming years.
The computer model includes changes that are beyond the city’s control, and it builds in the impact of spending needed to make the city sustainable into the future, both financially and in terms of service levels to the public. It features a control panel that allows users to change key factors. As variables — such as added spending, cost of living adjustments, new taxes or revenue growth rates — change, their impact is illustrated in graphs that show the resulting General Fund balance and financial condition.
“The fiscal model has given us a powerful long-range planning tool to help guide us through the development and housing downturn we are currently experiencing,” says Stockton Budget Director Tyson. “The variety of data inputs and quantity of different variables give the model a wide number of potential uses.”
Realistic Versus Conservative
Failing to understand the many factors at work in a long-term fiscal forecast can result in an unrealistically sunny outlook. When presented with the magnitude of fiscal challenges faced by their city, many officials react with shock, dismay and denial. They thought the difficult decisions had already been made and that financial problems would recede along with the Great Recession. Others maintain that the forecast is too dire, and that only a change in assumptions is required. Ultimately most officials come to understand the magnitude of their long-term budget gap and are ready to find solutions to attain a sustainable budget and organization.
If these challenges are identified well ahead of time, officials can adjust budget policies to minimize their negative effects. These models are especially useful in helping elected officials, labor groups, budget commissions and members of the public understand how their proposals will affect fiscal solvency. Armed with a robust forecast, city leaders can identify critical unmet needs, develop options to close funding gaps and create a plan to ensure the city is providing services as efficiently and effectively as possible.
The Revenue Gap and Cost of Benefits
Figure 1 below shows the gap that cities face in actual recurring General Fund revenue compared with the expectation of such revenue based on pre-recession performance. This chart combines the outcomes for nine cities by converting revenues to a per-capita basis. The average revenue gap is 47 percent of current recurring revenue.
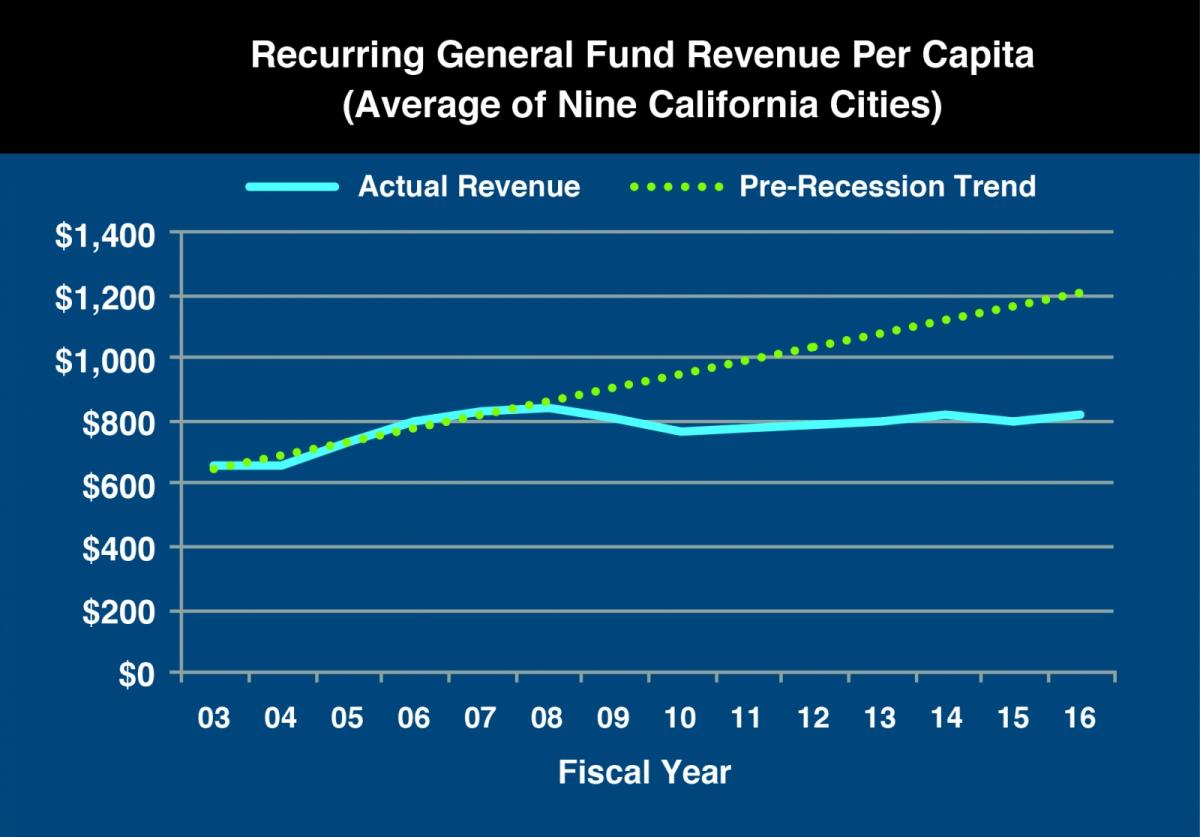
Figure 2 below shows the pension costs as a percentage of payroll, using the average of three cities that have had a long-term rate forecast prepared for them by an independent private actuary. Costs will rise in the near term, which will be challenging to cities, due to planned CalPERS contribution increases. These costs taper off in the middle term with the cumulative savings from lower benefit costs under the Public Employees’ Pension Reform Act (PEPRA) and decline in the long term as layers of unfunded liability are paid off. This chart assumes CalPERS maintains its 7.5 percent actuarial discount rate (investment return) each year. Pension costs will vary among cities based on actuarial reasons and benefit levels (including whether the city pays the employee contribution), but the overall profile as shown is generally applicable.
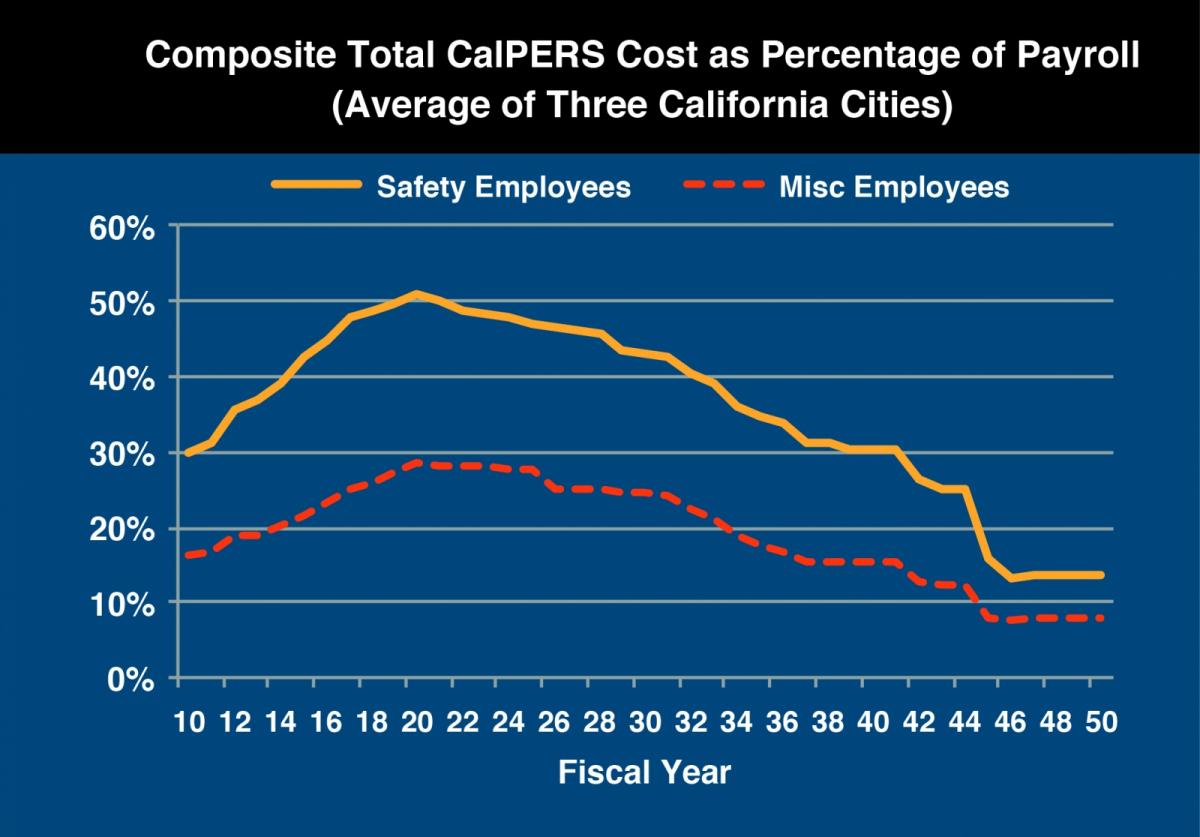
Photo credits: Everything possible/Shutterstock.com; Graphs, Source: Management Partners
This article appears in the November 2015 issue of Western
City
Did you like what you read here? Subscribe
to Western City