
Calculating Carbon Emissions
Yvonne Hunter is program director of the Institute for Local Government’s California Climate Action Network and can be reached at yhunter@ca-ilg.org. Dana Papke Waters is an air pollution specialist with the Climate Action and Research Planning, Research Division of the California Air Resources Board and can be reached at dpapke@arb.ca.gov.
In the late 20th century, Californians became more than just calorie conscious — we began reading nutrition labels to discover the caloric, fat, trans fat, sodium and vitamin content of food. We also select many of our activities based on the number of calories burned.
In the 21st century, as we become more attuned to addressing climate change, perhaps carbon counting will be the new calorie counting. Just as we want to know how many calories in our lunch come from fat, we are now interested in knowing the amount of carbon emissions associated with various activities and what we can do to reduce our impact on the environment — our carbon footprint. In fact, many climate change programs suggest “going on a low-carbon diet” for our personal, household, municipal or community activities.
Many daily activities, such as using natural gas to heat buildings or burning gasoline to drive vehicles, release carbon dioxide (CO2) and other greenhouse gases (GHGs) into the atmosphere. The resulting increased buildup of GHGs in the atmosphere is causing the earth’s climate to change, producing many impacts including higher (and lower) temperatures, less snow and rainfall and rising sea level.
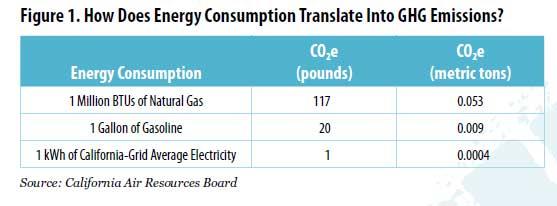
The most abundant GHG in our atmosphere contributing to climate change is CO2. Other GHGs — methane, nitrous oxide, sulfur hexafluoride, hydrofluorocarbons and perfluorocarbons — have a much higher global warming potential, which means that they are more potent than CO2. Many of these GHGs also have a long-lived impact on the environment. Numerous other climate forces contribute to climate change, but climate calculators typically account for emissions of the six GHGs listed here. Climate calculators “count” carbon by converting emissions of GHGs from various activities (such as using natural gas for heat or burning gasoline in vehicles) into what’s known as a carbon dioxide equivalent (CO2e), as shown in Figure 1.
Weighing the Options
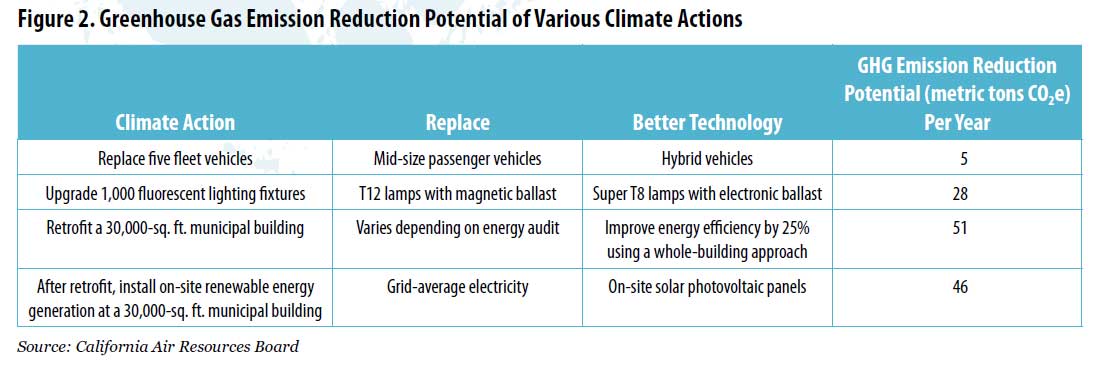
How do we judge the relative carbon reduction benefits of one activity over another? Which generates less GHG emissions — replacing a 20-year-old refrigerator with a new energy-efficient one, retrofitting city hall’s 100 fluorescent lamps or purchasing five new hybrid cars for the city fleet? Is it better to invest in high-efficiency fluorescent lamps or a new heating, ventilation and air conditioning (HVAC) system if you can’t do both? One city manager aptly wondered which would be a more effective use of his agency’s funds if the goal is to reduce GHG emissions. Should the city invest $500,000 in retrofitting city hall to be more energy efficient or in building a grade separation for the railroad tracks crossing Main Street? These kinds of questions are being asked more frequently as cities evaluate how to reduce their carbon emissions in the most cost-effective manner with limited resources. Figure 2 offers some examples of various carbon-reduction activities and compares their impact in metric tons of CO2e per year.
Making the analysis somewhat more challenging is the fact that all energy is not equal for the purpose of carbon calculating. For example, one kilowatt-hour (kWh) of electricity produced by a solar photovoltaic system generates less GHG emissions than one kWh of electricity generated by a typical power plant. Similarly, the GHG emissions produced by a hybrid vehicle (or a fuel-efficient, gasoline-powered car) are less than those produced by a car that gets low gas mileage.
The Local Government Toolkit (available online at www.CoolCalifornia.org) provides guidance and tools that local governments can use to reduce GHG emissions and save money. The toolkit estimates that if each California city replaced 1,000 existing fluorescent lighting systems (T12 lamps with magnetic ballasts) in municipal buildings with high-efficiency systems (Super T8 lamps with electronic ballasts), it would save 48 million kilowatt-hours of electricity — which translates into 19,200 metric tons of CO2e per year. Each city would emit about 28 to 40 fewer metric tons of CO2e per year through this type of lighting retrofit activity in a 30,000-square foot municipal building, saving $13,750 annually. At a cost of $50 each for 1,000 fixtures, the lighting retrofit would result in a 3.6 year payback or 27 percent return on investment.
The Local Government Toolkit includes information on financial resources as well as a prioritized checklist of no-cost, low-cost and advanced investment options that cities and counties can use to prioritize decisions. In addition, the Institute for Local Government’s California Climate Action Network provides numerous related resources for local governments at www.ca-ilg.org/climatechange
Getting the Most for Taxpayer Dollars
As local agencies take steps to reduce their carbon emissions and evaluate which best practices to use, they can also evaluate which activity will achieve the greatest carbon-reduction bang for their limited buck. Cities and counties are continuing to lead by example in reducing GHG emissions, thus using taxpayer dollars wisely and promoting sustainability at the same time.
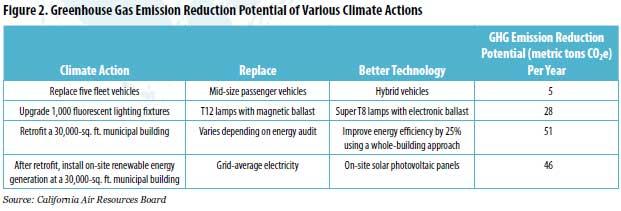
Click here for a larger view of Figure 2.
This article appears in the July 2009 issue of Western City
Did you like what you read here? Subscribe to Western City