Lessons of the November 2005 Special Election
This is not another column about the recent statewide election and the eight initiatives that were defeated. You won’t find that here. What interests me is something more relevant to the League: how voters reacted to a number of local measures that appeared on local ballots along with the statewide measures.
Before reflecting on the outcome of these campaigns and what it might mean, it’s important to understand who went to the polls on Election Day. While the turnout of registered voters in presidential election years in California tends to be quite high (up to 75 percent in 1990 and 2004, and only slightly less in 1994 and 1998), turnout in nonpresidential elections is substantially lower. As Sacramento Bee political columnist Dan Walters noted, “The last gubernatorial election in 2002 drew scarcely half of registered voters. Primary election turnout is even lower — just 44.3 percent in 2004, a presidential year, and 34.6 percent in 2002, a gubernatorial year.”
Since the early 1970s, California has had five special statewide elections. These elections have been particularly notable for low voter turnout (often less than 40 percent of registered voters), with the sole exception of the 2003 special election concerning the recall of former Governor Gray Davis (61 percent of registered voters). Prior to November 2005, the most recently completed statewide special election on ballot measures was in 1993, and it drew 36.4 percent. The turnout for the November 2005 special election was better than in most special elections (about 50 percent), but still fell short of providing a representative base of an increasingly independent electorate.
Who went to the polls in this election? It appears that people with strong party affiliations were motivated to vote, thereby favoring Democrats more than Republicans due to their greater number of registered voters.Furthermore, in the Republican strongholds in Southern California, the voter turnout was reportedly lighter than expected, as a general rule. It also appears that the governor lost the interest of and perhaps even the support of many of the moderates he attracted to his candidacy in 2003.
This background on turnout provides a helpful context for reviewing the outcome of a number of local races this past year. The information calls into question whether the success or failure of local tax and bond measure propositions was materially affected by voter turnout in the same way as the outcome of the state propositions. It’s interesting to note that, rather significantly, the answer appears to be “No.”
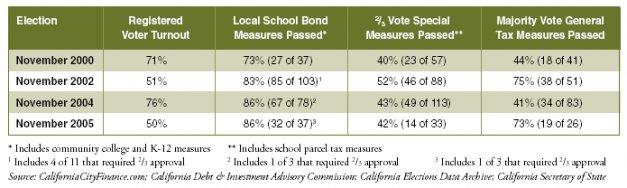
Voters in the last four statewide elections in November of 2000, 2002, 2004 and 2005 have not been notably less inclined to approve local bond issues and taxes, depending on the voter turnout. In fact, there are some contrary indications suggesting that voter attitudes on these issues have persisted (concerning taxes) and improved (concerning school bond issues), irrespective of voter turnout. This is what the data suggest to me, but it’s important to remember that this is a statewide perspective, and voter turnout could be significant in individual local contests. The relevant data appear in the chart above. You can decide for yourself.
A review of the election outcomes sends some pretty clear messages to local officials planning future tax and bond issue campaigns. In November 2005, most ballot measures (whether parcel taxes, special taxes or non-school bonds) that required two-thirds voter approval failed. Most school bonds (which now require 55 percent voter approval) passed, and continuation of existing school parcel taxes passed even if they required two-thirds voter approval. (Note that Proposition 39, which passed in November 2000, allows 55 percent approval for school bonds if they meet certain requirements. As a result, some school bonds still require two-thirds approval if they exceed Prop. 39 limits.) Most general tax measures, which required majority vote approval, passed. (My thanks to Michael Coleman, the League’s fiscal consultant, for these highlights.)
Details on Local Measures
Sales and Use Taxes — 70 Percent Approval. Sales and use taxes continue to be among the easiest types of tax increases to sell, with nine out of 13 (70 percent) being approved at the election, including three in Tulare County that required two-thirds approval and passed with more than 70 percent of the vote. The margin of victory in these elections ranged anywhere from 2 percent (Waterford’s 1/2 cent sales tax) to as high as 20.8 percent (Scotts Valley’s 1/2 cent sales tax increase).
Transient Occupancy Taxes — 75 Percent Approval. Underscoring the popularity of the adage, “Don’t tax you, don’t tax me, tax the guy behind the tree,” voters in three out of four jurisdictions (one of them a county) voted to increase their transient occupancy tax. The voter approval margins ranged from 8.5 percent to 18.6 percent. But if these had been special taxes and subject to the two-thirds approval requirement, only one would have passed.
Utility User’s Taxes (UUT) — 63 Percent Approval. While King City convinced 51.5 percent of voters to approve extending its UUT from 2 to 6 percent, proposals to increase or extend the UUT in four other cities failed. In Signal Hill, where the proposal would have funded police facilities and equipment and a two-thirds vote was required, the measure fell short of receiving even majority approval.
Miscellaneous General Taxes — 100 Percent Approval. Voters went to the polls in five cities to consider majority vote approval of general-purpose taxes. All got the simple majority vote needed. Taxes approved included a business license tax increase (Sunnyvale), a card room tax that garnered 69 percent of the vote (Ventura), continued approval of utility fund transfers (Vacaville), and a parking tax proposal (Millbrae). The highest rate of voter approval of any local tax measure (82 percent) was a proposal to double the admissions tax in Indian Wells.
Special Municipal Service (Parcel) Taxes and Bonds — 13 Percent Approval. Facing two-thirds approval requirements, voters in eight cities went to the polls to consider general obligation bond, parcel tax and special tax proposals for public safety, libraries, street and sidewalk improvements and other important purposes. Although six of the eight measures were approved by 55 percent or higher, only Fillmore’s tax for a swimming pool achieved the two-thirds mark.
School Parcel Taxes — 100 Percent Approval. All four school parcel tax measures, which required two-thirds voter approval, were successful. The two requiring simple renewal received voter approval of 76.8 percent and 79.9 percent. Those imposing new taxes still passed, with one even garnering 72.7 percent of the vote.
School Bond Measures — 92 Percent Approval. Voters went to the polls in 37 school districts to consider approving school bond measures, and in 32 of the 37 (86 percent) the voters said “Yes” by more than the 55 percent margin. If a two-thirds approval had been required, however, only 11 of the measures would have passed (30 percent), demonstrating the value of the constitutional amendment a few years ago that lowered the vote threshold necessary for school bond issues.
While statewide voter turnout may not affect the outcome of local elections significantly, the outcome of the 2005 special election suggests that the nature of a local tax proposal and the vote threshold requirement under state law seem to make a significant difference — except in school parcel tax elections, where the two-thirds vote requirement was apparently not an obstacle this time. City officials with an interest in proposing future local ballot measures are urged to carefully study the results of these elections.
This article appears in the January 2006 issue of
Western City
Did you like what you read here? Subscribe to Western City