Traffic fatalities across the US rose in 2020 but not in Fremont. What did the city do differently?
Brian Lee-Mounger Hendershot is the managing editor for Western City magazine; he can be reached at bhendershot@calcities.org.
In 2015, Fremont’s city council committed to a bold goal: Reduce traffic-related fatalities to zero. Even though the city was already a national leader in traffic safety, this new mindset forced officials to rethink their approach to traffic safety.
Known as Vision Zero, Fremont’s traffic safety plan focuses on integrating human error into transportation systems, instead of reducing it. Under Vision Zero, roads and streets are designed in such a way that when crashes occur, safer preventative measures ensure that most people walk away with only minor injuries.
Now five years into the project, the results speak for themselves. Fremont has an average fatality rate of 2.1 traffic deaths per 100,000 residents annually — significantly fewer than California and the U.S., where rates have risen to 9.1 and 11, respectively. Moreover, major crashes have decreased in Fremont by 45% since the program was adopted, something Public Works Director Hans Larsen is “extremely pleased with.”
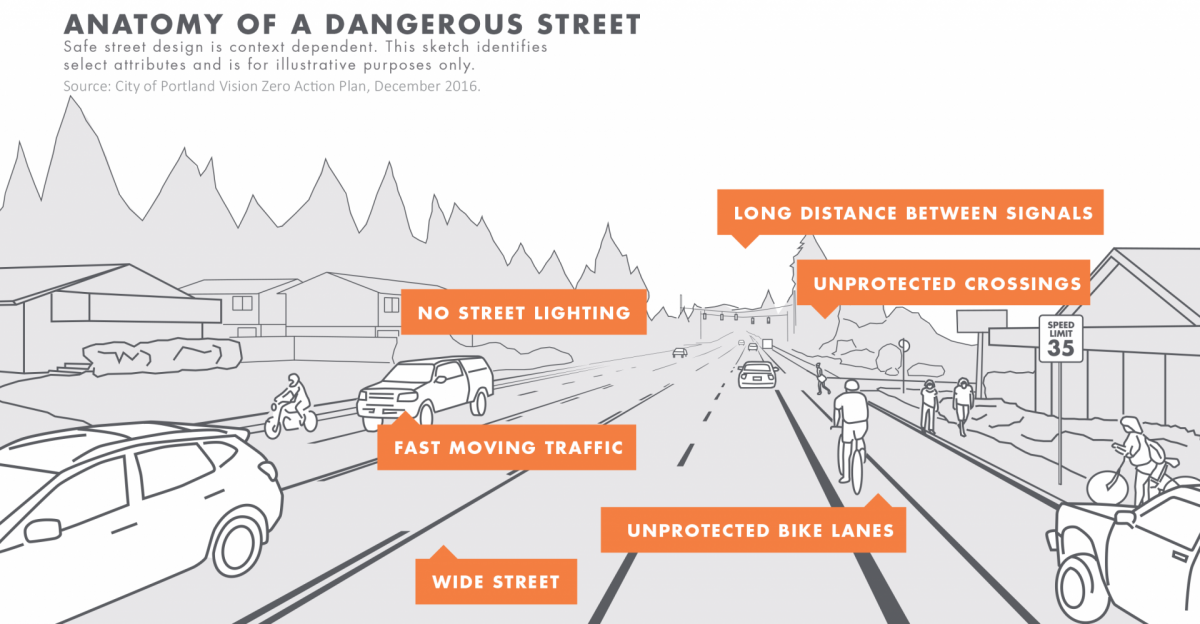
Historically, Fremont’s streets looked like any other streets in the U.S. Notably, they were built with 12 to 14-foot travel lanes, a standard that promotes high speeds and is more appropriate for traveling down freeways. Similarly, 40 of its crosswalks were uncontrolled and located in multi-lane, high-speed roadways. Fremont also had to contend with a state highway system that cut through the city and an outdated street lighting system.
Low-cost improvements lay the groundwork for long-term change and funding
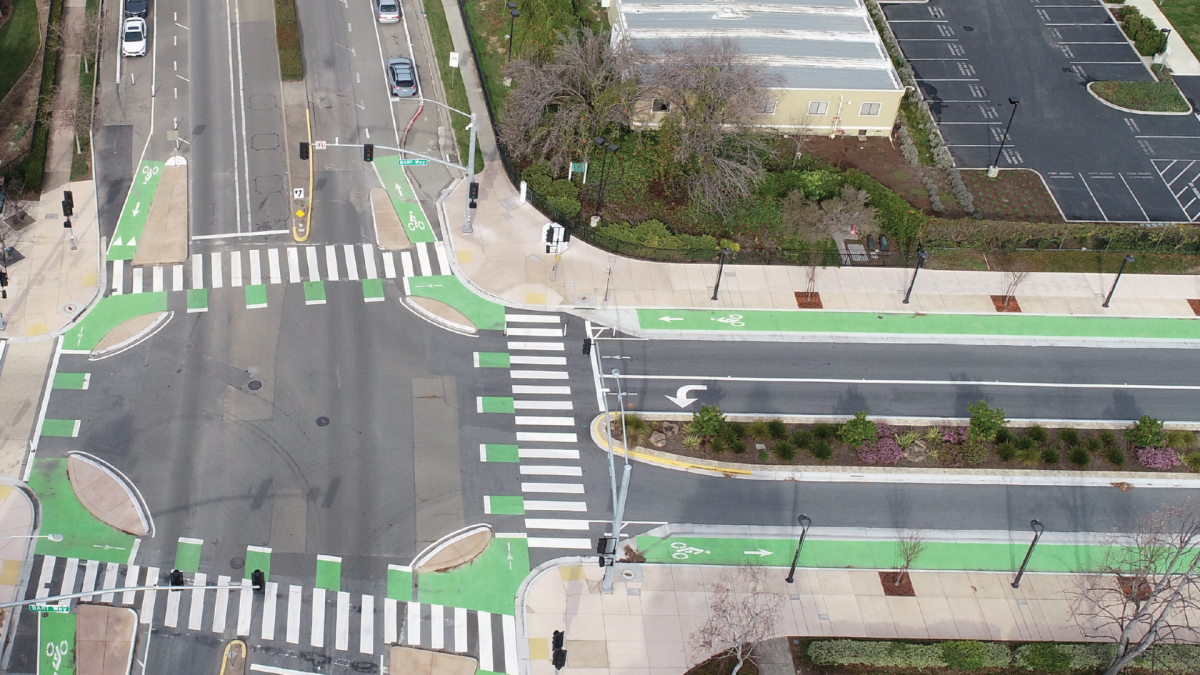
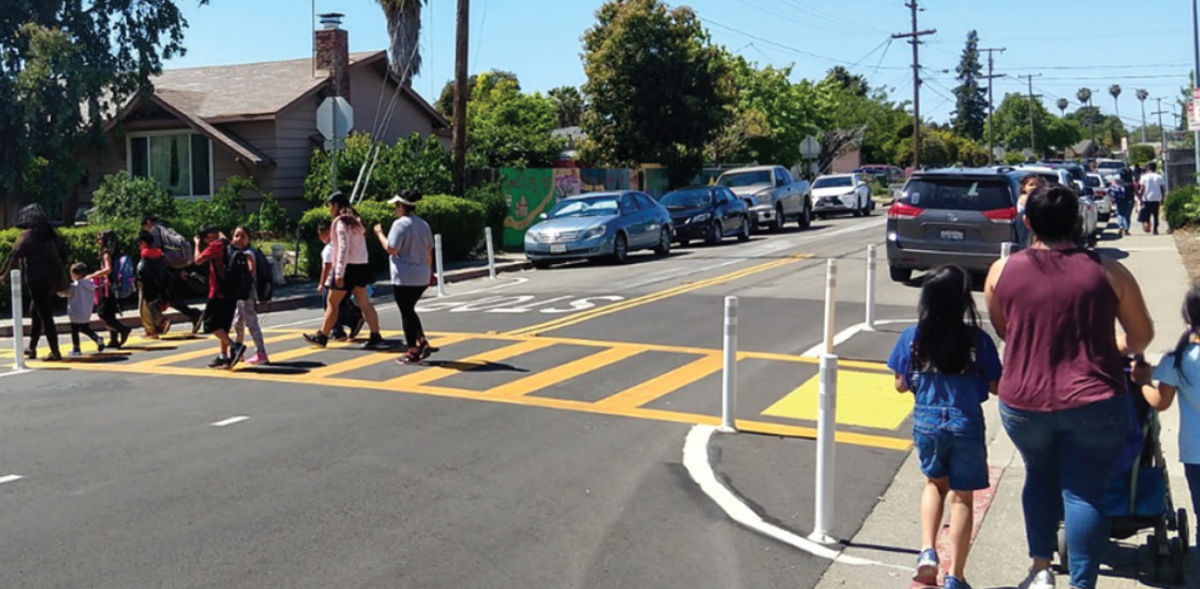
Today, many of its streets look different. The Fremont Public Works Department — which includes Transportation Engineering, Pavement Maintenance Program, and Street Maintenance — made extensive use of inexpensive, temporary, “quick-build” projects to improve safety for drivers, pedestrians, cyclists, and transit users alike in a relatively short period of time. The department also restriped 47% of the city’s arterial roadways, built protected intersections, upgraded dozens of crosswalks with short-term, reduced speeds in more than 50 street segments, converted its streetlights to use “white” LED lights, and decreased the number of lanes in several roadways.
Many of these changes were made along school routes. From 2013 to 2015, Fremont saw nine major crashes involving individuals 15 years of age or younger. It had just one such crash from 2018 to 2020.
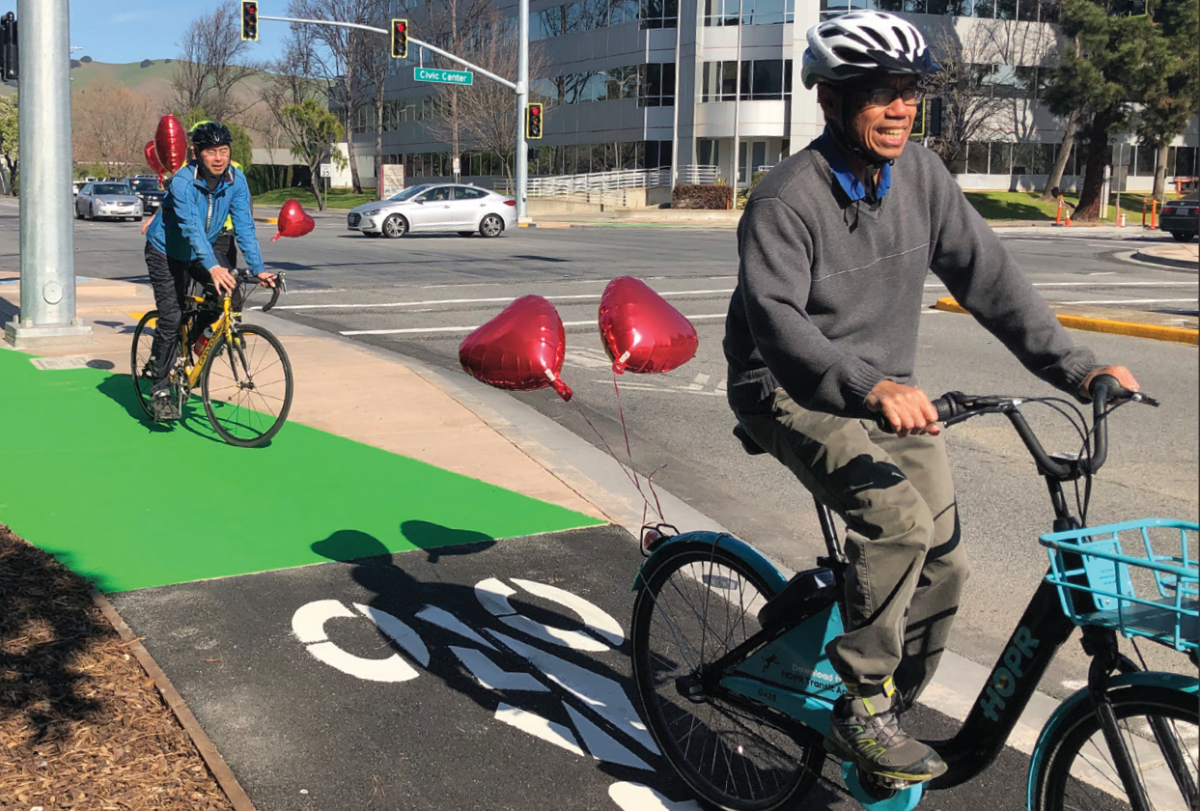
Initially, Fremont’s Vision Zero was achieved with zero new funding commitments or dedicated staff positions. Instead, existing resources were redirected from projects that did not serve the city’s new goals. Early projects also focused on the creative use of existing resources and low-cost improvements. The city was able to build on the success of those early years and attract grant funding for higher-cost projects, such as raised cycle tracks and protected intersections.
Fremont’s work to reduce traffic fatalities have also attracted national and regional recognition. The city received the 2021 “Transportation Safety Achievement” award from the National Institute of Transportation Engineers (ITE) organization and “Project of the Year” award from the Western ITE District.
“The city of Fremont continues to set the bar high and places our community’s safety as its highest priority,” stated Fremont Mayor Lily Mei. “I couldn’t be prouder of the efforts by our Public Works Department. As an early adopter of Vision Zero in the U.S., these recognitions are a testament to the forward thinking and innovative work our Transportation Engineering team has been dedicated to over the last five years.”
Good data and good communication create outstanding results
It’s not just what Fremont does; it’s how it chooses to do it. The city maintains strong internal, cross-agency partnerships and relies on high-quality quantitative and qualitative data to make decisions — sometimes in real-time, thanks to radar speed feedback signs. For example, the Public Works Department and the Police Department work closely together to maintain a map of high-risk crash locations. The map is generated using AutoCAD, software typically reserved for developing design plans, which the city already had in place.
“When we set out to reduce traffic fatalities to zero, in a focused and collaborative manner, we knew it would take the entire city and community to get behind the movement,” noted Larsen.
Fremont transportation engineers typically receive crash reports within 30 days of a crash — far quicker than in many other cities, where the wait may be a year or more after a crash occurs. Engineers summarize any pertinent information from the police reports into small, easily understood narratives. When a severe or fatal injury occurs, a dot is placed on the AutoCAD map.
Crashes that are clustered together indicate opportunities for improvement, which can be as simple as installing signage and vertical posts to improve driver yielding. Moreover, since the map is frequently updated, future infrastructure projects are based in the communities with the most need, not the most vocal, ensuring that dollars are spent equitably and efficiently.
These partnerships extend outside the planning room. For example, the Fremont Police Department largely conducts high-visibility traffic stops to provide warnings and education, rather than issue tickets and fines. This creates a visible enforcement presence without generating economic hardship. The city also formed partnerships with external organizations — most notably the Fremont Unified School District — to fund street improvements, education campaigns, and assessments.
Working with community stakeholders, the two organizations jointly funded school safety assessments at each of Fremont’s 40 schools, which laid the groundwork for more than 400 safety improvements. CJ Cammack, the district’s superintendent, is proud of the partnership’s results and the city’s approach to traffic safety.
“Throughout Fremont, we see ongoing projects to put additional safety measures in place, and we appreciate this major undertaking by the city to serve our community,” said Cammack.
Traffic engineers are also unafraid to use unusual techniques to solve persistent problems. For example, the city’s infamous high-speed Grimmer Curve was often featured in local media as a collision hot spot. Freemont tried “traditional” solutions, such as curve warning lights and high friction surface treatment, but with little success. After a crash that resulted in a vehicle in a backyard swimming pool, the city restriped the curve with narrower, 10-foot travel lanes, a buffered bike lane, and a K-rail in the bike buffer, which protected cyclists and forced motorists to drive at slower, safer speeds.
There have been no major crashes on the Grimmer Curve since the improvements were installed in 2016.
The city has also worked with Caltrans to add bike-friendly lanes to parts of State Route 84 and I-880. Route 84, which was relinquished to the city, also now includes on-street parking and outdoor dining parklet spaces. The results of the Route 84 improvements will ultimately inform additional streetscape improvements.
Fremont’s goals for the next five years
Fremont hasn’t reached zero yet — but it’s getting there. The next iteration of Vision Zero builds on the successes and opportunities of the past five years. The city’s internal data show that pedestrians and cyclists are still disproportionately affected by crashes, as are older people and unhoused residents. In Fremont, increasing traffic safety for the latter also means providing shelters and services, including safe parking zones.
“We are very pleased with the results over the first five years, but are still working toward our overall goal,” said Larsen. “We will continue to analyze data and utilize advanced technology and traffic safety measures to achieve safer streets, safer people, and safer vehicles for our community.”
Future success also depends on making changes to existing traffic technology. For example, traffic signals need to be timed so that drivers adhering to the speed limit will get a “green wave,” while those that speed will hit more red lights. More controlled pedestrian crossings are needed, as are better sightlines, protected turns and intersections, separated bikeways, and when appropriate, roundabouts. Fremont is also seeking to enact change at the state level and increase collaboration with regional agencies, with a particular focus on education and equity.
Fremont’s data-driven approach allowed it to work smarter, not harder. In doing so, it was able to dramatically increase traffic safety at a time when traffic fatalities were increasing regionally and nationally.
Ultimately, Vision Zero is but one piece of Fremont’s plan to “get to zero.” The city also has a Mobility Action Plan, a Bicycle Master Plan, a Pedestrian Master Plan, and a Safe Routes to School Plan, all of which provide location-specific recommendations and were developed with the community.


