
The Fiscal Challenges Ahead for Cities
This issue of Western City focuses on municipal finance. So it seems appropriate to look at some of the major policy and fiscal challenges facing cities over the next five to 10 years and how the tools presented in this month’s articles can be part of your overall fiscal management strategy.
President Harry Truman, who coined the phrase “the buck stops here,” also reportedly requested a one-armed economist. Apparently he was sick of economists proclaiming “on the one hand, this” and “on the other hand, that.” Today’s economists may be more willing to take a position, but they don’t always agree. Some recent economic projections in our state illustrate this point.
The UCLA Anderson School of Management economic forecast released Sept. 11, 2014, includes this statement about conditions in California: “The California economy is moving forward in an expansion from the depths of the Great Recession. But, even though the number of jobs is now higher than at any time in the past, the state remains below its potential in output and employment. That we are entering the sixth year of expansion illustrates just how painfully plodding this recovery process has been.”
On the same day the University of the Pacific’s School of Business issued an economic forecast that states: “Overall, the California economic outlook has changed little since May. California’s economy continues to grow, and non-farm payrolls recently surpassed their pre-recession, 2007 peak of 15.4 million jobs. 2014 is shaping up to be yet another year of moderate 2 to 3 percent growth in both employment and gross state product (GSP). The forecast anticipates stronger growth from 2015 to 2017 with real GSP growing between 3.5 and 4 percent, as homebuilding makes a larger contribution to growth.”
These leading economists believe our economic recovery is still “painfully plodding” and, at least in the case of the University of Pacific projections, that there may be stronger growth around the corner from 2015–17. These forecasts and the fact that they don’t necessarily agree suggest a number of possible approaches to revenue projections for the next five years. One thing we do have a good handle on is the recent past, and the news of the past few years, from a statewide perspective, is positive.
City General Revenues: Moderate Recovery, but Uneven Throughout the State
Few if any of us have probably ever experienced anything like the contraction in city revenues that occurred during the Great Recession. As everyone in local government knows (because every city was negatively affected to some extent), the decline in every major revenue source required making tough cutbacks and innovative service arrangements and deferring necessary investments in infrastructure and equipment.
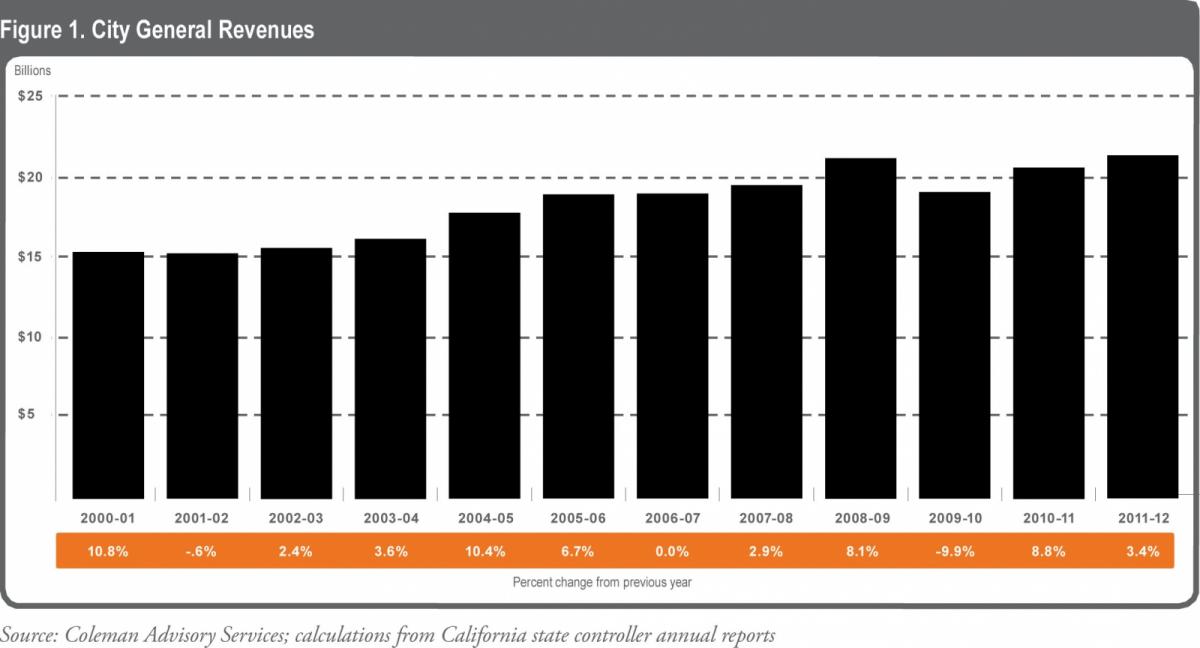
As Figure 1 illustrates, it is clear that from a statewide perspective city general revenues have returned to the level from which they fell in FY 2009–10 at the time of the Great Recession. As always, however, in a state as diverse as California, the recovery has been uneven, with coastal cities often faring better than those inland. Many cities are only now beginning to consider giving salary increases after four to five years of austerity and employee “give backs” and concessions. Moreover, cities made significant reductions in the number of full-time employees. The loss of redevelopment in 2011 has made this picture and the overall revenue picture of cities even bleaker.
What Did Not Get Done
In addition to reducing personnel, cities had to defer routine infrastructure maintenance and replacement to survive the recession. Fewer streets, bridges, buildings and other real estate assets were maintained unless there was a source of fee revenue to support the work or a federal infrastructure grant to finance it. In October 2014 the League and the California State Association of Counties (CSAC) released a report estimating that cities and counties together face $78.3 billion in unfunded street and road improvements over the next 10 years. According to one national transportation research group, the failure to maintain our highways is also costing California motorists $44 billion annually, or over $2,000 per motorist personally on average per year, due to additional vehicle operating costs, congestion-related delays and traffic crashes.
Questions About the Future Viability of the Sales Tax
While the sales tax has long been a source of steady revenue growth for cities, changes in the economy and the burgeoning market for e-commerce are posing some serious challenges about the future of the sales tax as a major leg of the three-legged stool of city revenues (property tax, sales tax and miscellaneous taxes and fees).
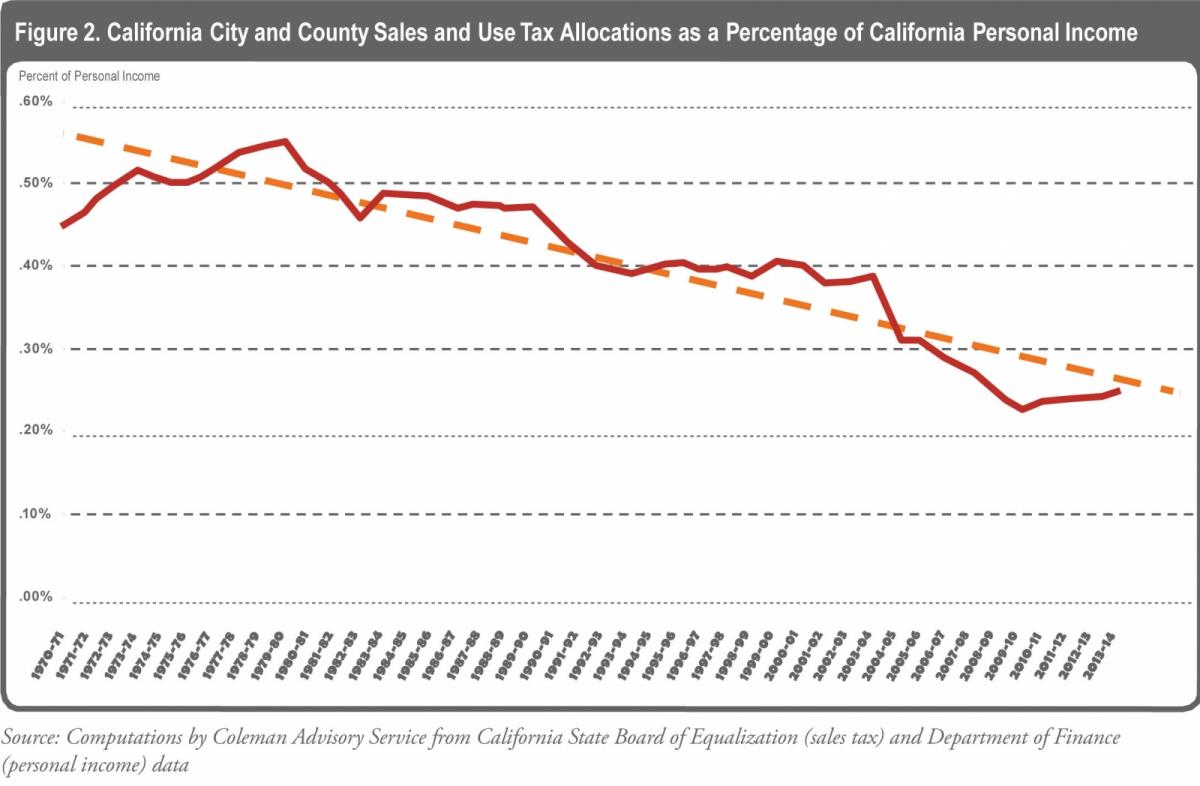
Data from the California State Board of Equalization, shown in Figure 2, demonstrate that sales tax collections as a percentage of personal income have fallen from 0.53 percent in 1974 to 0.24 percent in 2012. This suggests its declining value as a local revenue source because so many retail sales escape taxation due to two major factors:
- The shift in consumer consumption from taxable retail goods to untaxed services; and
- The growth of e-commerce that largely escapes taxation.
We have known for a long time that our sales tax base has become increasingly obsolete as more untaxed music, software, information storage and other services grow. Moreover, as the population ages, spending preferences shift to services (including health care) and taxable spending declines.
The once-fledgling e-commerce market is on the way to becoming the fastest-growing part of the economy, and it is still largely untaxed because Congress has failed to pass legislation leveling the playing field between e-commerce and traditional brick-and-mortar businesses. According to the U.S. Census Bureau, since 2005 e-commerce as a share of total retail sales has increased from 2.4 percent to 6.4 percent. In the second quarter of 2014, total retail sales increased 2.3 percent and e-commerce sales increased 4.9 percent.
California’s composite sales tax rate is among the highest in the nation and its base among the narrowest. Services and intangible goods are not taxed — yet that is where the growth in the economy is occurring.
![]()
Pensions and Retiree Health Care: The Gift That Keeps on Giving
Defined benefit pensions used to be the gold standard in the private and public sectors, providing solid but not extravagant retirement benefits to employees who dedicated their lives in service to their employer. As private business consolidations and mergers occurred at an unprecedented rate over the past two decades, companies began to abandon defined benefit programs that created such high “legacy costs” for their balance sheets and started substituting less generous but highly portable 401(k) retirement savings and investment plans. While the private sector was abandoning traditional pensions for the new model, the public sector in California went the other direction, beginning in 1999.
Apparently convinced that the economic surge that began in the late 1990s would go on forever, the state Legislature authorized richer retirement options for both miscellaneous and public safety employees. Following the state’s lead, cities, counties and special districts began adopting these enhancements without really considering the long-term liabilities that such plans created. The most expensive were the ones that were retroactive, suddenly increasing pension rewards for prior rather than future service.
When the 2008 Great Recession hit and the California Public Employees’ Retirement System (CalPERS) and stand-alone local pension plans suffered serious investment losses, unfunded liabilities increased dramatically for both the state and local agencies. CalPERS made some quick changes and lengthened the time period over which the losses would be recognized to reduce the increases on employer and employee contributions. But it soon became clear that this policy of constantly pushing losses off into the future was threatening the funding status and increasing the volatility of the various plans administered by CalPERS.
CalPERS changed its “smoothing” policies in 2013, raising employer contribution rates significantly over the next five years. In early 2014, recognizing that people are living longer, CalPERS raised rates again to improve the plan’s long-term sustainability. Once again local agencies experienced rate increases that will be phased in over a five-year period.
Combined with cities’ retiree health and dental care liability (referred to as other post-employment benefits or OPEBs), the unfunded liabilities of cities for pensions and OPEBs are daunting. One manager of an otherwise well-financed city told me recently that in year three of his city’s five-year financial forecast, the pension rate increases alone will put the city into a deficit spending position, even if they assume healthy revenue growth, and it worsens in the subsequent years. Another city advised me that the CalPERS rate increases over the next five years will consume all of its future revenue growth during that time, leaving nothing left over for salary increases — and likely forcing service and staffing reductions.
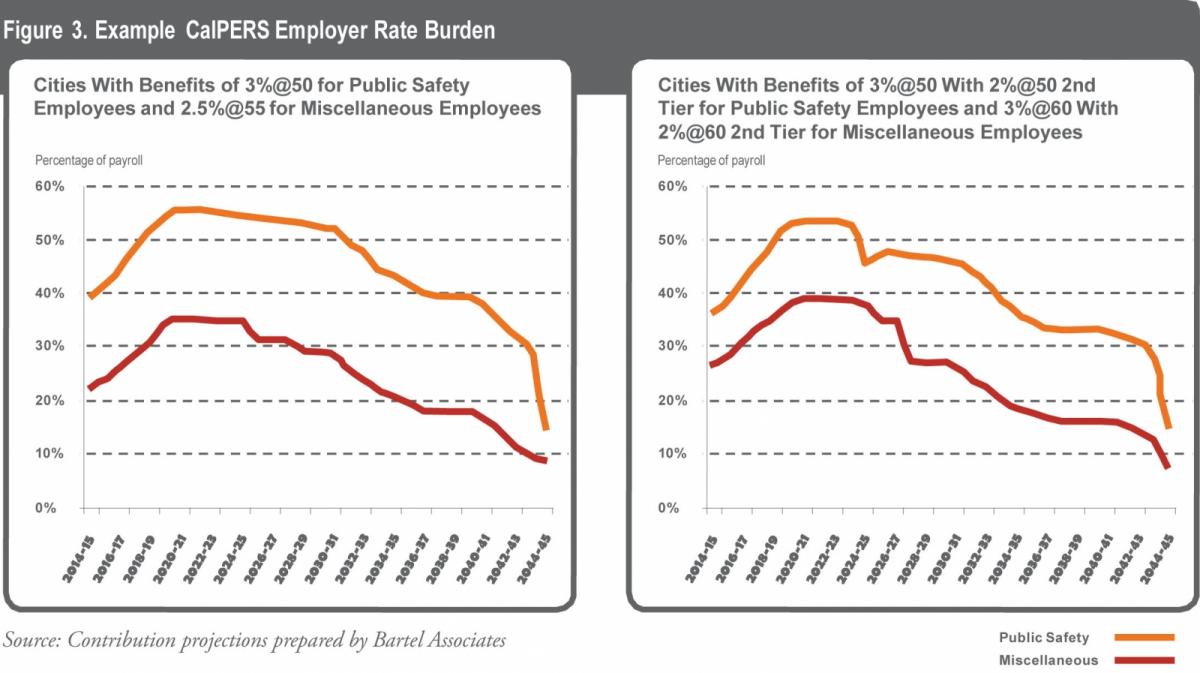
Figure 3 illustrates the depth of the fiscal challenges facing cities over the next few years, shown by types of benefits provided. For many cities, pension contributions to CalPERS for public safety employees will rise dramatically over the next five years. If there are no future benefit enhancements, costs will start moderating after 2022. While this illustrates the long-term nature of the problem, the next five to 10 years are expected to be the most expensive and painful. In the near future CalPERS expects to explain to employers how local public agencies can prefund their individual unfunded pension liabilities if they have the available cash. For some cities this will prove to be a very prudent step.
The state, cities and other local agencies also face retiree health-care burdens that could be more than their unfunded pension liabilities. As in the case of pensions, the best solution to this problem is to prefund this liability through an irrevocable OPEB trust arrangement through Public Agency Retirement Services (PARS), CalPERS or an insurance company. Meanwhile, cities are conducting major reassessments of their retiree health commitments in light of the Affordable Care Act and other factors.

Taking the Long View
With three major municipal bankruptcies in California cities in recent years, it is clear that the risks of overcommitting a city to long-term liabilities are not just theoretical — they are real. For this reason the League has made a commitment to help city leaders dedicate themselves to using the best tools to assess their fiscal risks and to charting a future course to reduce those risks. The article on page 13, “League Provides Municipal Financial Health Diagnostic Tool” by the League’s fiscal adviser Michael Coleman, describes a new fiscal diagnostic tool he has developed at our request, which cities throughout the state are beginning to use.
While there are no easy answers to how to manage through the next 10 years, there are tools, techniques and options that need to be discussed with city employees and the public in order to make the best choices for each city. As with everything else, there is no one-size-fits-all solution, but cities are beginning to look at the next five years and developing options to emerge on the other side with their major public services intact — perhaps configured in a different way and costing less, but nonetheless intact and serving city residents in effective and efficient ways.
Photo credit: Digital Storm/Shutterstock.com; Ldprod/Shutterstock.com; Digital Storm/Shutterstock.com
This article appears in the November 2014 issue of
Western City
Did you like what you read here? Subscribe to Western City